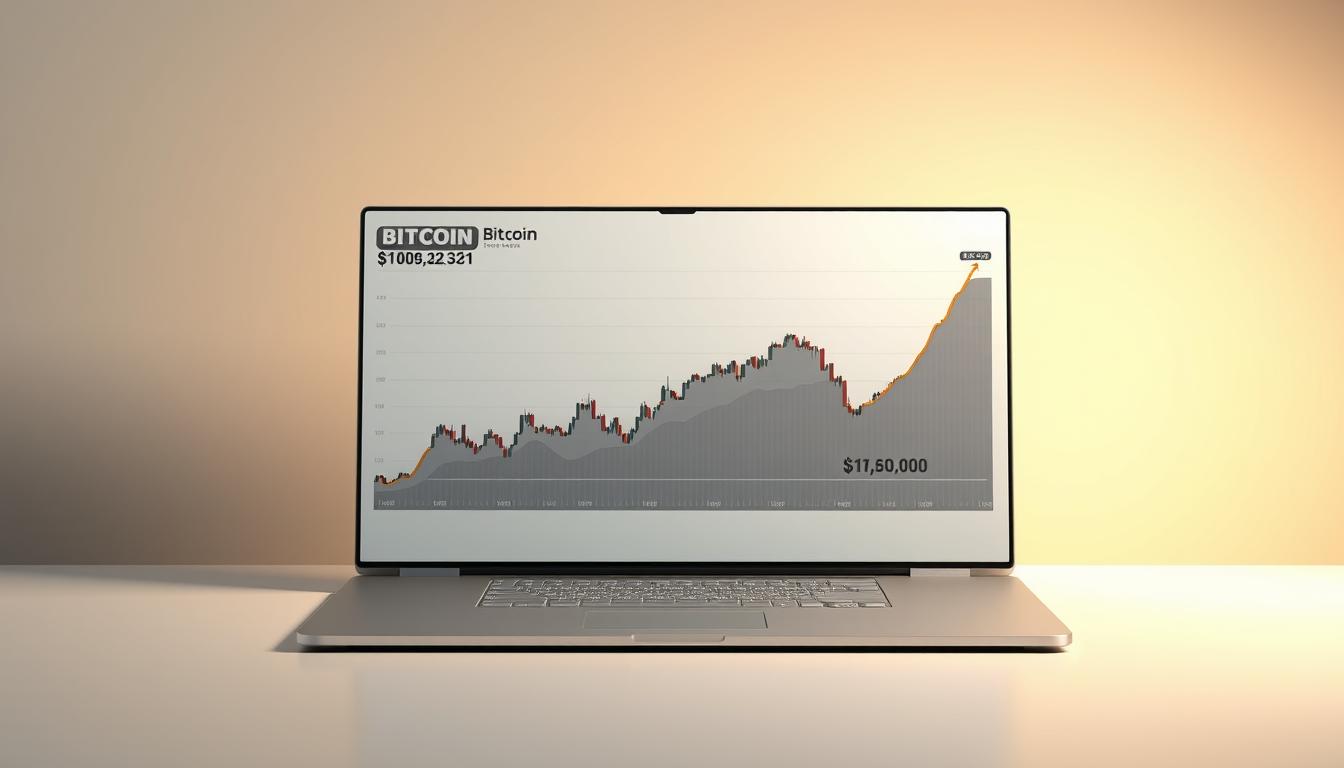
Last week, 75% of Bitcoin’s trading happened during five sharp moves. This shows even in calm times, the market can be turbulent. The Bitcoin price is now between $118K and $122K. It seems like a break as both big investors and traders make their moves.
According to a recent update from JaiInfoway on August 18, 2025, Bitcoin’s price was around $120,500. Its market cap was nearly $3.98T with a daily trading volume of $183B. This matches my understanding. There’s hope tied to ETFs and big buyers are interested. Yet, there’s also a risk. Big sales and over $1B in liquidations show the market could quickly drop.
Looking at the charts, Bitcoin’s price is high in its rising channel. It’s just above a key level at $115K. Support levels are found between $117K and $115K. Resistance levels are between $121K and $123K. The current price range is narrow and uncertain. The RSI and MACD indicators don’t agree on what might happen next.
In simple terms, $118K is a critical support level, and $123K could lead to a larger price increase. If the price drops below $117K, the situation could change quickly. Right now, the market is in a delicate state. It’s balancing between those taking profits and new investments. We’re in a pause, not heading for a major shift.
Key Takeaways
- Bitcoin is trading inside the $118K–$122K consolidation box with heavy institutional flows in the background.
- Recent intraday volatility included an ATH near $124,277 and swift corrections, driven partly by taker sell spikes.
- Technical support sits near $117K–$115K; resistance clusters at $121K–$123K and then $126K.
- Macro data (PPI 3.3%) creates headwinds; keep an eye on liquidity and liquidation events.
- Short-term direction likely hinges on a decisive break below $118K or above $123K.
Understanding Bitcoin Price Consolidation
I like to think of consolidation as the market taking a breather. It is when the price moves within a certain range. This happens while traders and algorithms weigh their risks. You’ll see prices move less, tight trading patterns, and key levels tested often.
What is Price Consolidation?
Price consolidation occurs when there’s a stand-off between buyers and sellers. It can be seen from Coinbase flows and how deep the order book is. I look for signs in selling pressure and where money pools to figure out the market’s next move.
Importance of Price Ranges
Price ranges help traders set clear limits for their trades. The 118k to 122k bitcoin range gives a clear area for adding bets. Important tools like moving averages guide us on where the price might head next.
How Consolidation Affects Market Sentiment
Market mood changes when prices stick to a range. Holding steady can make buyers more confident. But, unexpected news can quickly turn the market’s mood sour.
During these periods, I use a checklist to understand the market. It includes looking at key levels, trend indicators, and how much bitcoin is being traded. This tells me if the market is setting up for a rise or expecting a fall.
| Aspect | What I Watch | Why It Matters |
|---|---|---|
| Support/Resistance | Edges at $118k and $122k, intraday re-tests | Defines high-probability trade zones |
| Volume | Aggregate taker sell/buy spikes and VWAP | Shows distribution vs accumulation |
| Indicators | MACD, RSI, SMA50/SMA200 cross | Measures momentum and trend strength |
| Order Flow | Liquidity clusters, depth, large limit orders | Predicts likely breakout direction |
| Macro Triggers | Economic prints, Fed signals, ETF flows | Can convert consolidation into directional moves |
Current Market Overview
Every morning, I check the market stats. Today brings a familiar vibe with active institutions and ETF talk lifting prices. At the same time, macro indicators and big sell-offs cause price swings during the day. The latest on bitcoin shows it at about $120,500, a slight gain in 24 hours. Its trading volume is around $183 billion, with fear and greed levels in the low 70s.
Key Bitcoin Price Stats
As reported by JaiInfoway, bitcoin’s price hit around $120,500, climbing 1.4% in one day. Prices swung from a high of approximately $124,277 to a low of $118,427 due to profits being taken. Over $1 billion was liquidated market-wide in the last day. Of this, about $218 million was in bitcoin and $309.9 million in Ethereum.
Bitcoin’s Historical Price Trends
Since mid-June, Bitcoin’s price has been rising slowly but steadily. Tools like Fibonacci and moving averages show key levels that traders keep an eye on. Analysis suggests a major breakout could reach between $130K and $135K. However, if it fails, prices might fall back to earlier levels.
Comparison with Other Cryptocurrencies
Other cryptocurrencies like ETH, BNB, and SOL have seen higher gains this month. They each have different RSI profiles and support levels. Yet, Bitcoin remains the main focus for investors and holds the largest market cap. It attracts the majority of the $43 billion institutional investments, especially towards ETFs. This keeps traders focused on the bitcoin chart for immediate updates.
Macro factors play a big role too. A US PPI of 3.3% has shaken up the market, making it more volatile. A single $6.25M liquidation of an ETH position shows how quickly things can change. That’s why I watch price movements, volumes, liquidations, and larger economic indicators closely. It helps me understand bitcoin’s price beyond just the numbers.
Analysis of the $118K-$122K Range
The $118K–$122K range is like a battlefield. It shows how buyers and sellers fight and who might win. Prices move up and down, finding support and resistance. Together, on-chain data and technical levels show us where Bitcoin’s price stands.
Technical indicators give mixed signals. The MACD suggests a possible rise, hinting at gains. The RSI tells different stories depending on the timeframe. Some show there’s room to grow, while others signal caution.
Watching key moving averages is crucial. The SMA200 offers strong support around $115,912. Meanwhile, the SMA50, near $118K, could lead to more moves. The pivotal point is reclaiming Fib 0.618 at $115,000 for the bulls.
Technical Indicators at Play
- RSI varies, showing both potential and risk.
- MACD is leaning towards a positive turn on daily charts.
- Support levels to watch are $117,009 and $115,912 (SMA200).
- Major resistances stand at $121,151 and $123,966.
Volume is a key part of the story. A spike in sell volume was noted by CryptoQuant, reaching around $3.13B. This coincided with large liquidations, leading to rapid price movements.
Volume varies greatly. It might rise with buyers stepping in, suggesting they are gathering Bitcoin. Other times, big sells happen fast, wiping out gains. This led to a sharp drop after a peak near $124,277.
Volume Trends in this Range
- Big sell-offs near the top hint at traders hunting for liquidity.
- Over $1B in liquidations can cause fast drops.
- At times, more buying can be seen, showing interest.
- The result? Quick changes within a tight price range.
Since mid-June, prices have moved little, sticking between $112K and $121K. This past movement sets the stage for future targets. Technicals suggest a near-term goal of about $121,775, with more possible gains to $129,811.
Past trends in similar ranges have led to fast moves. When the volume backs up positive signals, prices can spike. However, high sell volumes can lead to quick downturns and a return to lower supports. We should watch for momentum and where bigger trades occur.
Historical Performance within Similar Ranges
| Period | Range Observed | Trigger | Outcome |
|---|---|---|---|
| Mid-April | $110K–$118K | Strong buying and more volume | A jump to $124K then a drop |
| Late May | $115K–$121K | A positive MACD and higher RSI | A quick rally to $123K, then a fall |
| Mid-June | $112K–$121K | Steady, low activity | Prices stayed flat, then eventually broke out |
Looking at the current Bitcoin price, outcomes depend on several factors. If buying continues and the MACD stays positive, prices could head towards our targets. However, if selling spikes again, it could push the price down to the SMA200 area.
So, this analysis of Bitcoin’s price focuses on trading patterns, the MACD, RSI, and moving averages. It’s best to consider these together to predict the next moves in the $118K–$122K range.
Factors Influencing Bitcoin’s Price Today
Watching markets is like looking at a weather forecast. Changes come quickly due to large trades or global events. Making a bitcoin price prediction is complex. I consider many factors like trades, big buyers, and news stories.
Market Trends and Investor Behavior
Big institutions play a key role. Recent data shows they invested about $43 billion. This investment supports demand and hints at a positive future for bitcoin prices.
Yet, actions from smaller players or immediate sell-offs can quickly lower prices. Once, there was a $3.13 billion increase in selling, leading to price drops. These changes can overpower usual market trends for a while.
Regulatory News Impacting Prices
The stance of regulators is crucial for long-term market views. When regulatory news is positive or when there’s hope for easier stock market entries, confidence grows. This improves bitcoin price outlooks.
Also, opinions from well-known individuals can sway the market. A single statement can lead to big changes in how people invest, affecting bitcoin prices.
Economic Indicators to Watch
Economic reports also guide market sentiment. For instance, a report showed a 3.3% increase in the US Producer Price Index, hinting at high inflation. This worried investors, impacting bitcoin negatively despite other positive signs.
I keep an eye on major economic updates, including Consumer Price Index and Federal Reserve announcements. They influence overall market liquidity and risk, which can affect bitcoin price forecasts.
| Driver | Immediate Effect | Why it Matters |
|---|---|---|
| Institutional Inflows | Support around demand zones near $120K | Large, steady bids reduce downside and inform medium-term forecasts |
| Taker Sell Volume & Liquidations | Sharp intraday volatility | Can overwhelm technical setups and trigger cascade moves |
| Regulatory Headlines | Sentiment swings lasting days to months | Directly affects ETF flows, custody adoption, and investor confidence |
| Macro Data (CPI/PPI/Fed) | Shift in risk-on/risk-off dynamics | Affects leverage, funding costs, and the timing of market rotations |
| Technical Structure (SMA50/SMA200, Fib) | Defines breakout and retracement targets | Used by traders for entries; combined with flows, refines price movement outlook |
By monitoring big investors, market shake-ups, and major economic indicators, I make flexible bitcoin price predictions. My outlook changes with the latest facts.
Graphical Representation of Price Movements
I draw charts for clients to understand price changes better. A good visual separates unimportant details from important ones. I add Fibonacci levels, SMA50/200, MACD, and a volume histogram to show where buyers and sellers were active.
Daily Price Chart and Analysis
The daily chart looks promising and might indicate a bullish trend. The MACD is moving towards a positive cross. And the daily RSI is close to 59, which suggests there’s space for growth. The SMA50 is at about $114,020 and the SMA200 at around $115,912, both below the current price, hinting at a bullish outlook.
The volume profile indicates buying on green candle days, but there were spikes in selling on the highest-price day, causing quick changes. This combination gives a clear daily pattern. The $115K level, near Fib 0.618, is important for traders to reclaim.
Comparison Chart with Previous Weeks
Intraday and 4-hour charts offer more detail. There was a high of $124,277, then a sharp drop to about $118,427. The 4-hour charts show a downward trend from the $123K high, signaling some bearish moments in an overall bullish trend.
Zones around $115K–$112K and a potential liquidity gap near $120K pinpoint where trading action concentrated. A demand area is visible between $110K–$107K on larger dips, serving as a strong support zone.
Key Takeaways from Graphical Data
The charts serve as guides to what might happen. A clear move above $123K, confirmed by volume, would mean continuation of the bullish trend. Without it, prices might drop back to the $110K–$107K support area.
Preparing slides for meetings, I label possible outcomes and important price levels. This helps make bitcoin price changes more understandable and useful for clients. It also shows how sudden market moves can obscure the overall trend of bitcoin prices.
| Chart Element | Observed Level / Signal | Implication |
|---|---|---|
| SMA50 | $114,020 (below price) | Supports short-term bullish bias |
| SMA200 | $115,912 (below price) | Confirms longer daily strength |
| Fib 0.618 | ~$115,000 (reclaimed) | Key support on pullbacks |
| Daily RSI / MACD | RSI ~59; MACD crossing up | Room to run if momentum holds |
| Intraday peaks | High at $124,277 then drop to $118,427 | Shows liquidity hunts and taker spikes |
| Range / Demand Zones | $115K–$112K; $110K–$107K | Areas to watch for re-entry or deeper pullbacks |
| Volume Profile | Accumulation on bullish candles; taker sell spikes on ATH day | Volume needed for confident breakout |
Predictions for Bitcoin’s Price Movement
I look at short and long-term trends to understand Bitcoin’s value. Analyzing Fib levels, channel studies, and how money flows helps. This approach makes my Bitcoin price predictions more reliable.
In the short run, I see the price moving slightly. JaiInfoway thinks Bitcoin might stay around $120,500 soon. It could swing between $119K and $122K. A strong surge might push it to $129,811.
I’m also prepared for a possible drop to between $119K and $120K. I watch for changes in the market that could lower prices fast.
Recent market actions show Bitcoin could fall. It dropped 4% after hitting $124,277. Sell volume was high, reaching $3.13B. This suggests a possible dip to between $119K and $118K. A drop in PPI could push prices even lower, potentially to the $110K area.
My short-term strategy depends on certain conditions. I’ll buy more only if the price ends the day higher than $123K. If it does, I’ll aim for targets at $123,966 and $126,781. But if it falls below $117,000, I’ll cut losses quickly as it might drop to $115,912 or $112,167.
Looking ahead, I’m optimistic. Factors like institutional investment and market trends after halving hint at a price increase. If we break above $123K and the money keeps flowing in, we could reach $130K–$135K.
I prefer flexible strategies over set predictions. For the short term, I’m cautious of a small downturn. In the long run, growing demand and stabilizing market conditions indicate a rise in Bitcoin’s price over months.
Frequently Asked Questions about Bitcoin Price
I answer questions simply, as if chatting with a friend over coffee. I cover three main topics about bitcoin price: its movements, how to analyze it, and if the current price range is a good chance to buy.
What Causes Price Fluctuations?
The main factor is supply and demand. Big investments, ETF activities, and specific orders affect prices. Events like changes in CPI or PPI can lead traders to adjust their risk assessments quickly.
Activities on the blockchain are also key. For instance, a rise in sell orders or big transactions might lead to a sell-off. How people feel about the market, shown by things like the Fear & Greed Index, also impacts prices, especially when many people start buying or selling.
How to Analyze Market Trends?
I use a combination of tools. I start with blockchain data for sell orders and transactions, then look at chart indicators like RSI and MACD. Combining these methods offers a full view.
I also look at trading volumes and where traders are placing their stop-loss orders. By keeping an eye on the economic calendar, I know when to expect bigger price changes. A good analysis uses all these tools together.
Is Consolidation a Good Time to Buy?
During price consolidation, the risk is usually lower if the price stays above support levels. Traders often see $118K as an important level and wait for signs to buy more.
It’s crucial to manage your risk. Setting limits on how much to invest and when to cut losses helps. Using a dollar-cost averaging strategy can make entering a fluctuating market less stressful.
Tools for Monitoring Bitcoin Prices
I use a select set of tools to monitor bitcoin market movements. My go-to resources include snapshots, technical dashboards, and exchange apps. This combination helps me stay on top of bitcoin prices and act quickly on sudden changes.
Best Price Tracking Websites
CoinMarketCap provides simple market stats, such as caps, volume, and rank. TradingView offers detailed charts with indicators like SMA and MACD for analyzing patterns. For deeper insight, Glassnode and CryptoQuant offer metrics like volume and flows seen on the bitcoin chart.
Mobile Applications for Investors
On my mobile, I use Binance, Coinbase, and CoinStats for quick trading. These apps show real-time prices, profit/loss, and portfolio distribution. Instant alerts from these apps keep me updated on bitcoin prices, no matter where I am.
Setting Up Alerts for Price Changes
Alerts are set for specific price levels, such as daily highs or lows, and on-chain activities like volume spikes or exchange outflows. By doing this, I get notified of meaningful market changes. It helps filter out the market noise.
- Use TradingView for fibs, trendlines and community scripts.
- Watch CryptoQuant or Glassnode for taker volume and net flows.
- Keep CoinMarketCap for quick market snapshots.
- Enable exchange app alerts for instant execution.
A Step-by-Step Guide to Investing in Bitcoin
I write from experience. I keep plans simple: pick a reputable exchange, set allocation, choose a strategy, and protect the position. This way, I can handle bitcoin price changes calmly.
Where to buy
Start on big platforms like Coinbase, Binance, or Kraken for buying and holding. These places have what you need for big-money moves. They also offer stablecoins like USDT and USDC for easy trading during ups and downs.
When I need the bigger picture on market shifts, I check out detailed reports: bitcoin technical summary.
Investment strategies
Choose between spreading out purchases or buying in one go. Spreading out helps ease in when prices are stable. Buying all at once is good when there’s a clear sign prices will go up based on your research.
How much to buy is important. I buy enough so a bad move won’t wreck me. Remember, using borrowed money makes wins and losses bigger. Quick losses in the market prove that.
Risk management tips
Pick a stop-loss that fits your risk level, like below $118K if that’s your limit. Stay clear of borrowing too much. It’s smart to spread your investments to be ready for good chances.
For safe keeping, use hardware wallets and trusted custody services for larger amounts. If trading, stick to your exit plan. Big losses happen fast, taking down those not careful.
This simple guide helps you pick how to get in, with smart exits and goals based on market trends.
| Plan | Entry Method | Suggested Stop | Near-term Target | Notes |
|---|---|---|---|---|
| Conservative DCA | Weekly buys on Coinbase or Kraken | Personal risk threshold | $126K–$130K | Reduces timing risk, suits long-term holders tracking bitcoin price movement |
| Opportunistic Lump-Sum | Buy on breakout above $120K on Binance | Below $118,200 | $130K initial, $250K long-term | Higher short-term risk, higher reward; aligns with bullish bitcoin price prediction scenarios |
| Short-term Trading | Spot and regulated margin on Kraken | Strict, small % stops | $120K resistance then $126K | Requires active monitoring; recent $800M long-liquidations warn of sudden moves |
| Custodial Long Hold | Purchase and transfer to hardware wallet or regulated custodian | Use cold-storage best practices | Halving-driven cycles, institutional ETF flows | Best for holders targeting multi-year upside tied to macro cycles |
Here’s my advice: choose a trusted exchange, decide how much and how to invest, be cautious with how much you buy, and keep your long-term investments safe offline. Keep an eye on bitcoin’s price to adjust your strategy and see how it reacts to big news.
Evidence Supporting Current Trends
I look at numbers, charts, and what people say every day. The current story is very clear. Big organizations are gathering more and showing strong interest, while everyday folks are also eager, judging by the Fear & Greed Index. To get a quick view of the market, I check a recent summary that talks about ETFs and price changes; see this for details: Bitcoin market summary.
On-chain numbers give us extra details. Reports from CryptoQuant and tallies of exchange liquidations reveal sudden sells and over $1 billion in liquidations in one day. This involves both BTC and ETH, indicating some are taking profits and avoiding risk for now. These moments are crucial in understanding bitcoin prices as they show where money was quickly taken out and where many had set their limits.
Looking at past patterns shows why the price range of $118K–$122K is important. After staying above certain averages for months, prices often jumped toward $130K–$135K. Yet, if they fell below $112K, steeper drops usually followed. Adding up these big money moves, on-chain events, and chart trends helps us understand what’s happening with bitcoin prices. It shows why being in the $118k to $122k range is key for guessing what comes next.